Benchmarks
Feature comparison
| Feature | pycocotools | faster-coco-eval | hotcoco |
|---|---|---|---|
| Installation | Prebuilt wheels available | Prebuilt wheels available | Prebuilt wheels — pip install just works |
| Metric parity | Reference | Exact | All metrics exact to float precision (≤3.7e-14) |
| LVIS evaluation | No | Yes — via lvis_style=True flag |
Yes — 13 metrics, LVISeval class, init_as_lvis() |
| TIDE error analysis | No | No | Yes — 6 error types, ΔAP per type |
| Confusion matrix | No | No | Yes — cross-category, configurable threshold |
| F-scores | No | No | Yes — F-beta at any β |
| Per-class AP | Manual only | Yes — via extended_metrics |
Built-in via get_results(per_class=True) |
| Dataset operations | No | No | Yes — filter, merge, split, sample, stats |
| Format conversion | No | No | Yes — COCO ↔ YOLO, VOC, CVAT, DOTA, Open Images CSV |
| PyTorch integration | Via torchvision | Yes — TorchVision compatible | Yes — CocoDetection, CocoEvaluator |
| Rust API | No | No | Yes — native crate on crates.io |
| CLI | No | No | Yes — coco (Python) + coco-eval (Rust) |
| Results export | No | No | Yes — JSON with params + metrics + per-class |
| Memory at scale | Exceeds physical RAM on O365 | Exceeds physical RAM on O365 | Completes within physical RAM (details) |
| Python versions | 3.9+ | 3.7+ | 3.9+ |
| License | BSD | Apache 2.0 | MIT |
Speed benchmarks
Hardware: Apple M1 MacBook Air — 8 cores (4 performance + 4 efficiency), 8 GB RAM Dataset: COCO val2017 — 5,000 images Detections: 36,781 synthetic — see Methodology Timing: Wall clock time — per-cell median of 3 runs, at both 1× and 10×. The two scales were captured separately and the machine was busier during the 10× capture, so absolute times are comparable only within a table; the speedup ratios are not affected. Versions: pycocotools 2.0.11, faster-coco-eval 1.7.2, hotcoco 1.0.0
Results (1x detections)
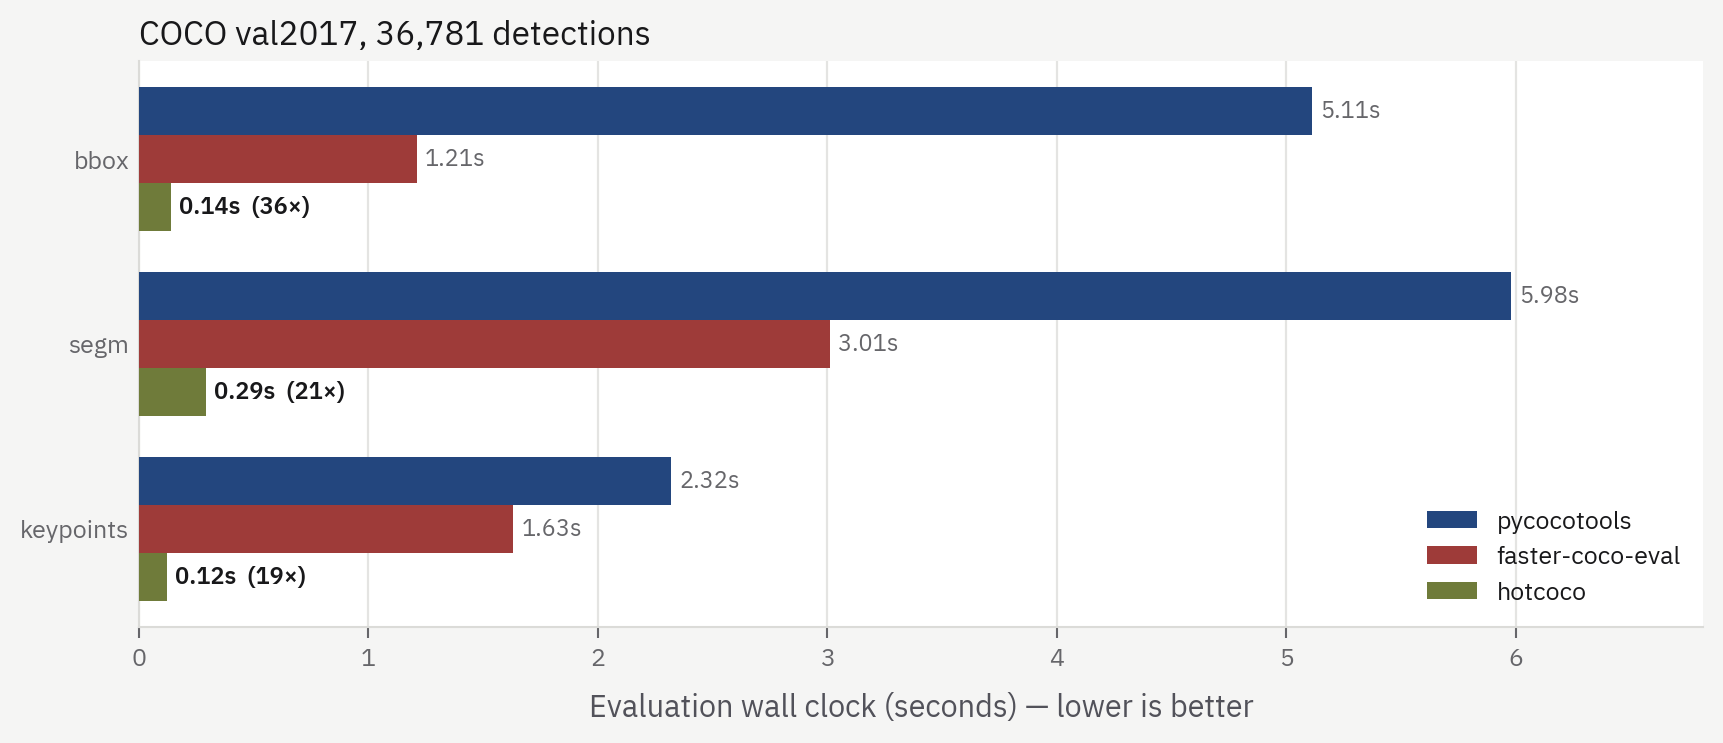
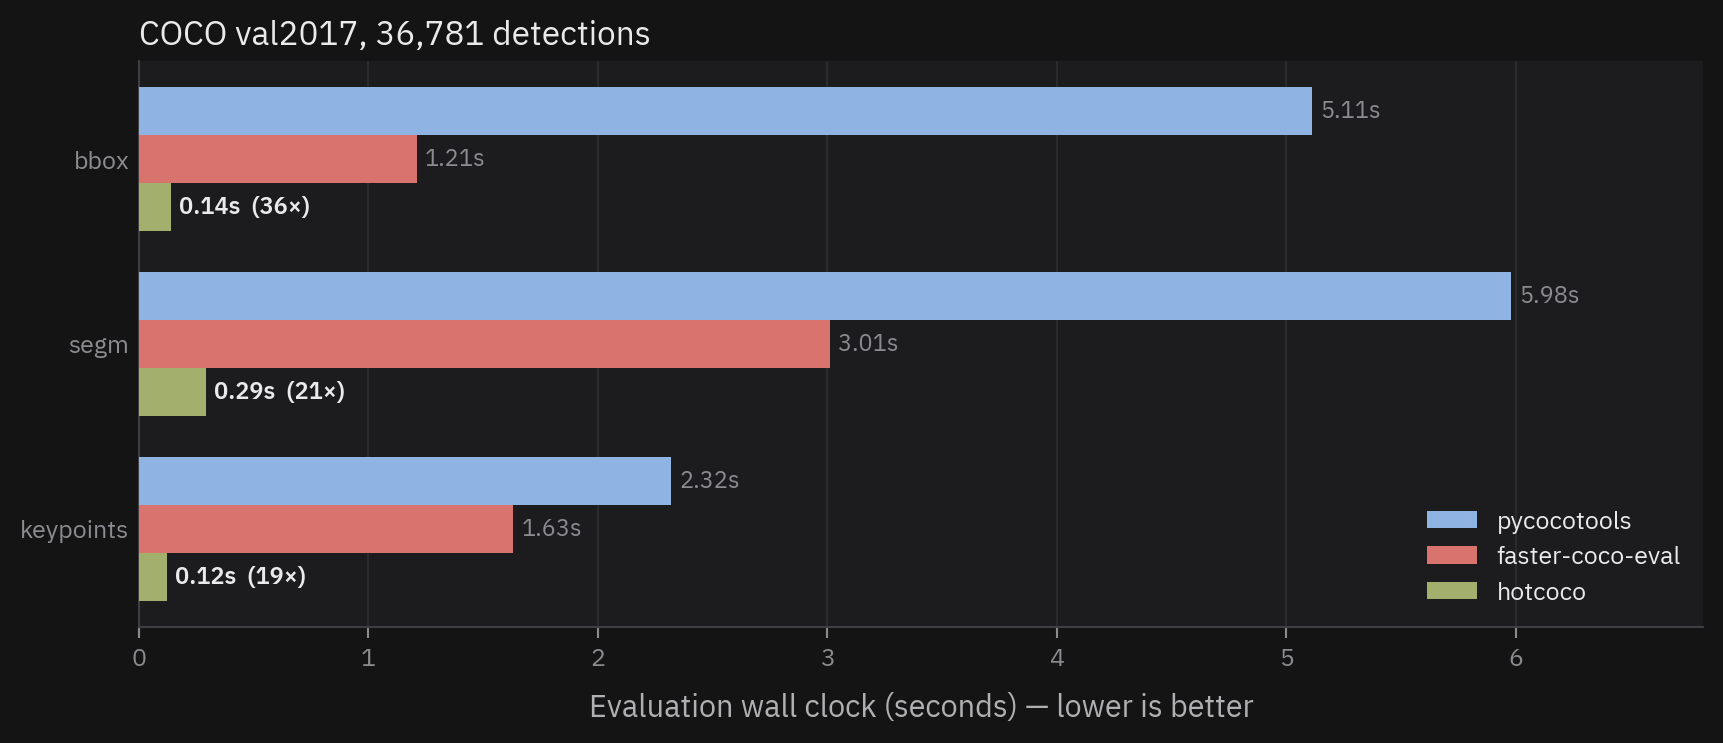
hotcoco.plot.| Eval Type | pycocotools | faster-coco-eval | hotcoco |
|---|---|---|---|
| bbox | 5.11s | 1.21s (4.2×) | 0.14s (36.2×) |
| segm | 5.98s | 3.01s (2.0×) | 0.29s (20.8×) |
| keypoints | 2.32s | 1.63s (1.4×) | 0.12s (18.8×) |
Speedups in parentheses are vs pycocotools.
Results (10x detections)
Scaling detections by 10x (~368,000) to test behavior under higher load:
| Eval Type | pycocotools | faster-coco-eval | hotcoco |
|---|---|---|---|
| bbox | 20.92s | 3.93s (5.3×) | 0.63s (33.4×) |
| segm | 24.16s | 8.05s (3.0×) | 1.53s (15.8×) |
| keypoints | 9.86s | 7.83s (1.3×) | 1.24s (8.0×) |
Absolute times stay under 2s at 368,000 detections. hotcoco's relative advantage is narrower here than in the 1× table — 8–33× rather than 19–36× — because per-call overhead, where it gains most, is a smaller share of the total once there is this much work to do.
Where the time goes
The preceding end-to-end numbers blend two very different phases: load (JSON
parsing and index building — COCO() + loadRes) and eval (evaluate +
accumulate + summarize). Splitting them shows where each library spends its
time (single run, same synthetic detections as the 1× table):
| Eval type | Phase | pycocotools | faster-coco-eval | hotcoco |
|---|---|---|---|---|
| bbox | load | 0.35s | 0.33s (1.1×) | 0.07s (4.9×) |
| eval | 4.67s | 0.98s (4.7×) | 0.07s (69.0×) | |
| segm | load | 0.44s | 0.43s (1.0×) | 0.13s (3.3×) |
| eval | 5.57s | 2.59s (2.1×) | 0.16s (35.5×) | |
| keypoints | load | 0.52s | 0.54s (1.0×) | 0.09s (5.5×) |
| eval | 1.82s | 1.10s (1.7×) | 0.03s (63.3×) | |
| bbox, bbox-only GT | load | 0.17s | 0.12s (1.4×) | 0.04s (4.2×) |
| eval | 4.73s | 1.03s (4.6×) | 0.06s (73.9×) |
The evaluation engine itself is 35–74× faster than pycocotools; the end-to-end headline is lower because JSON parsing is a much larger share of hotcoco's total than of anyone else's.
The bbox-only GT row strips the polygon segmentation the official instances files carry on every annotation — about two-thirds of the file bytes, which bbox evaluation never reads. It represents datasets that never had masks (custom bbox datasets, YOLO conversions, Objects365), where the load column is the one you'll actually see.
Objects365 scale benchmark
Hardware: Windows 11, AMD Ryzen 5 5600X — 6 cores / 12 threads, 16 GB RAM + swap Dataset: Objects365 val — 80,000 images, 1.2M annotations, 365 categories Detections: ~1.2M synthetic bbox (capped at 100/image, seed=42) Timing: Wall clock time, single run Versions: pycocotools 2.0.11, faster-coco-eval 1.7.2, hotcoco 0.3.0 — this run predates the 1.0 loading work, so the hotcoco figure is conservative
| Library | Time | Peak RAM | Committed | Speedup |
|---|---|---|---|---|
| pycocotools | 721.18s | 14.34 GB | 23.71 GB | baseline |
| faster-coco-eval | 250.90s | 14.57 GB | 29.96 GB | 2.9x |
| hotcoco | 18.32s | 7.47 GB | 8.11 GB | 39.4x |
Peak RAM is the peak working set (physical memory). Committed includes swap — both pycocotools and faster-coco-eval exceeded physical RAM and relied heavily on the pagefile, which significantly inflated their wall clock times. hotcoco completed within physical memory with minimal swap.
Metric parity
Reference: pycocotools 2.0.11, numpy 2.4.3.
Ground truth: COCO val2017 — 5,000 images.
Detections: the published instances_val2017_fake*_results.json files from
ppwwyyxx/cocoapi, the same inputs pycocotools uses in its own
tests.
Every metric agrees to within 3.7e-14 — floating-point noise, the last few
bits a f64 can represent. The diffs in the following tables are raw measured differences, not rounded.
Bounding box
| Metric | pycocotools | hotcoco | Diff |
|---|---|---|---|
| AP | 0.57793065 | 0.57793065 | 3.02e-14 |
| AP50 | 0.86052720 | 0.86052720 | 8.88e-16 |
| AP75 | 0.60003745 | 0.60003745 | 1.04e-14 |
| APs | 0.32723763 | 0.32723763 | 1.57e-14 |
| APm | 0.70684507 | 0.70684507 | 3.63e-14 |
| APl | 0.91751661 | 0.91751661 | 1.27e-14 |
| AR1 | 0.42708926 | 0.42708926 | 3.33e-16 |
| AR10 | 0.68690535 | 0.68690535 | 6.66e-16 |
| AR100 | 0.70127765 | 0.70127765 | 2.22e-16 |
| ARs | 0.43712612 | 0.43712612 | 0.00e+00 |
| ARm | 0.80637778 | 0.80637778 | 3.33e-16 |
| ARl | 0.95956720 | 0.95956720 | 5.55e-16 |
The threshold grids are constructed to match numpy.linspace bit-for-bit, which
removed the last systematic source of divergence here.
Segmentation
| Metric | pycocotools | hotcoco | Diff |
|---|---|---|---|
| AP | 0.65763117 | 0.65763117 | 1.11e-14 |
| AP50 | 0.92315461 | 0.92315461 | 8.77e-15 |
| AP75 | 0.70141134 | 0.70141134 | 6.55e-15 |
| APs | 0.46056290 | 0.46056290 | 9.49e-15 |
| APm | 0.77182113 | 0.77182113 | 1.19e-14 |
| APl | 0.93431919 | 0.93431919 | 6.11e-15 |
| AR1 | 0.45457448 | 0.45457448 | 4.44e-16 |
| AR10 | 0.74556101 | 0.74556101 | 1.78e-15 |
| AR100 | 0.76167772 | 0.76167772 | 1.89e-15 |
| ARs | 0.54570783 | 0.54570783 | 0.00e+00 |
| ARm | 0.85891625 | 0.85891625 | 0.00e+00 |
| ARl | 0.98103170 | 0.98103170 | 4.44e-16 |
Exact. The residual segmentation once carried (AP ~1e-5) came from polygon
rasterization, where the reference's C compiler contracts s*t+ys into a single
fused multiply-add on arm64 but not on x86-64, whose PyPI wheels target a baseline
without the instruction. hotcoco mirrors that choice per architecture, so the
comparison is exact on either kind of machine. Masks can differ by a boundary pixel
between the two architectures — as pycocotools' own do.
Keypoints
| Metric | pycocotools | hotcoco | Diff |
|---|---|---|---|
| AP | 0.41255451 | 0.41255451 | 1.67e-15 |
| AP50 | 0.60631206 | 0.60631206 | 1.11e-16 |
| AP75 | 0.42916428 | 0.42916428 | 1.11e-16 |
| APm | 0.40337197 | 0.40337197 | 1.39e-15 |
| APl | 0.88304294 | 0.88304294 | 1.44e-15 |
| AR | 0.76642003 | 0.76642003 | 1.11e-16 |
| AR50 | 0.97481108 | 0.97481108 | 0.00e+00 |
| AR75 | 0.80636020 | 0.80636020 | 0.00e+00 |
| ARm | 0.62190658 | 0.62190658 | 0.00e+00 |
| ARl | 0.96335935 | 0.96335935 | 0.00e+00 |
Keypoint metrics are exact. Keypoint evaluation reports 10 metrics — see Keypoint evaluation.
TIDE
Reference: tidecv, on COCO val2017 at pos_thr=0.5.
Expect the five false-positive types to agree closely and Miss to read higher here:
| Error | hotcoco ΔAP | tidecv ΔAP | hotcoco count | tidecv count |
|---|---|---|---|---|
| Cls | 0.0002 | 0.0000 | 13 | 13 |
| Loc | 0.1115 | 0.1135 | 3,121 | 3,738 |
| Both | 0.0007 | 0.0001 | 726 | 766 |
| Dupe | 0.0001 | 0.0000 | 27 | 37 |
| Bkg | 0.0109 | 0.0105 | 6,039 | 6,414 |
| Miss | 0.0242 | 0.0075 | 1,102 | 529 |
The ranking — which error type is costing you the most AP — is the same, and that is
what the metric is for. The difference comes from crowd handling: hotcoco builds TIDE
on the same COCO-convention matching as its AP (so tide_errors() and ev.stats
always agree about which detections exist), while tidecv removes crowd regions from
matching entirely — its false-positive counts run higher and its Miss runs lower as
a result.
Open Images
Reference: the TensorFlow Object Detection API — the implementation the official protocol page points to.
Open Images evaluation is compared over 70 cases covering group-of absorption, IoA containment at and around the 0.5 boundary, undetected group-of boxes, overlapping group-of boxes, and randomized multi-class scenes. Both mAP and per-class AP are compared, and every case agrees to within one ulp (worst difference 1.11e-16). It runs in CI on every commit.
Two things that comparison does not cover, and why provenance still reports
"extension" for Open Images runs:
- Non-exhaustive image-level labels. The challenge ignores detections of a class not verified on an image, and counts detections of a negatively-labeled class as false positives. hotcoco does not implement this — it needs per-image label data that COCO-format JSON cannot carry. A real challenge submission would score differently.
- Hierarchy expansion is applied to annotations before evaluation rather than inside it, so it sits outside the compared surface.
Verify it yourself
You do not have to take these numbers on faith, and you should not have to clone the repo to check them. Install both libraries and run your own ground truth and detections through each:
import contextlib, io
import numpy as np
from pycocotools.coco import COCO as PyCOCO
from pycocotools.cocoeval import COCOeval as PyCOCOeval
import hotcoco

GT, DT, IOU_TYPE = "instances_val2017.json", "my_detections.json", "bbox"

def run(coco_cls, eval_cls):
    with contextlib.redirect_stdout(io.StringIO()):   # both print a lot
        gt = coco_cls(GT)
        dt = gt.loadRes(DT)
        e = eval_cls(gt, dt, IOU_TYPE)
        e.evaluate(); e.accumulate(); e.summarize()
    return np.asarray(e.stats)

ref = run(PyCOCO, PyCOCOeval)
got = run(hotcoco.COCO, hotcoco.COCOeval)

for i, (a, b) in enumerate(zip(ref, got)):
    print(f"[{i:2}] pycocotools={a:.8f}  hotcoco={b:.8f}  diff={abs(a - b):.2e}")
print("max diff:", np.abs(ref - got).max())
Anything above ~1e-12 on your data is worth opening an issue — that is the threshold the project's own parity gate uses.
The same shape works for hotcoco.mask against pycocotools.mask, operation by
operation.
Beyond val2017, a hypothesis-based fuzzer checks ~10,000 generated datasets — including degenerate zero-area boxes and other edge cases hand-written tests miss — against pycocotools at a 1e-10 tolerance.
Methodology
- Wall clock time includes file I/O, evaluation, and accumulation. Excludes Python import time.
- Core count affects the ratio. hotcoco evaluates in parallel; pycocotools is single-threaded. Speedups therefore scale with the cores available, and the numbers here come from an 8-core machine — a 4-core laptop sees less, a 32-core server more. Run the suite on your own hardware for a figure that describes it.
- Detections are synthetic — generated from GT annotations with a fixed seed (
seed=42), so AP scores are meaningless but detection count and format are representative of real model output. Fixed seed means results are identical across runs. - Only detections are scaled for the 10x benchmark — ground truth annotations are unchanged.
Reproducing the benchmarks
These run from a repo checkout — see CONTRIBUTING for the build. One command fetches the annotations and generates the synthetic detection files:
just download-coco # ~240 MB — val2017 annotations + parity result files
That produces:
data/
├── annotations/
│   ├── instances_val2017.json
│   └── person_keypoints_val2017.json
├── bbox_val2017_results.json
├── segm_val2017_results.json
└── kpt_val2017_results.json
With that in place:
just bench                                  # speed benchmark (1x)
uv run python scripts/bench.py --phases     # load/eval phase breakdown
uv run python scripts/bench.py --scale 10   # 10x stress test
just parity                                 # metric parity vs pycocotools
just parity-mask                            # hotcoco.mask vs pycocotools.mask, operation by operation
just parity-tide                            # TIDE vs tidecv
just parity-oid                             # Open Images vs the TF Object Detection API
just fuzz                                   # hypothesis fuzzer, ~10,000 generated datasets
The Objects365 benchmark needs a separate download:
uv pip install polars
just download-o365                              # ~220 MB — O365 val annotations
uv run python scripts/bench_objects365.py